


.jpg)
Yogi Schulz
@itworldca
Published: April 9th, 2014
Improving data management processes and applying visual analytics software are the solution to squeezing business value from big data.
If you’re struggling to make sense of the flood of data streaming into your organization, improving data management processes and applying visual analytics software are the solution to squeezing business value from it.
Here’s a quick overview of the topic with some suggested links for further reading.
Big data refers to the incredible growth of data. I particularly like the definition SAS has published. For a summary of the business challenges and opportunities that big data presents, this McKinsey article, Big data: The next frontier for innovation, competition, and productivity, describes it well.
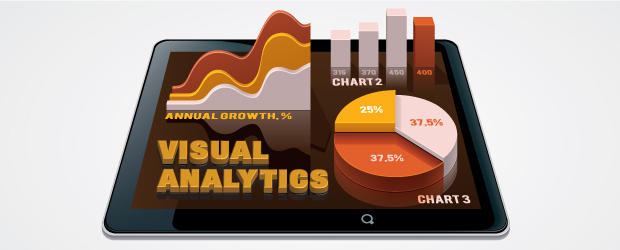
Visual analytics is more than just visualization of data — it’s an integrated approach to decision-making that combines visualization, human factors and data analysis.
The big problem is that we’re easily overwhelmed by too much data, especially if it’s displayed as a mind-numbing avalanche of rows and columns. The game-changing insight visual analytics seeks to address is to make this huge data volume intelligible through colorful graphs, neat dashboards for monitoring KPI’s and other appealing representations. For a summary discussion of the value proposition associated with visual analytics, I like this Bain & Company monograph: The value of Big Data: How analytics differentiates winners.
To actually achieve the value proposition of visual analytics you’ll need some software. There’s a choice of cross-industry software tools or an industry-specific application.
As you might expect, there’s a group of visual analytics software vendors who want you to license their software tools to help you squeeze value from your data. This Gartner report, Magic Quadrant for Business Intelligence and Analytics Platforms, describes the vendors and software tools well.
The problem is these are software tools and not finished applications. They all offer superior software development productivity but you still need to create some form of application before you can achieve any value. If a finished application is available for your industry, you are likely better off giving preference to that application even though it’s not listed in the Gartner report. An example finished visual analytics application for the oil & gas industry is called VISAGE.
If you’re interested in trends that may predict where analytics is headed, Deloitte has published a worthwhile analysis.
If you’re interested in more detail on how visual analytics produces value from big data, please request a copy of my presentation on this subject that expands on this blog entry.